4 GerminaQuant data processing
4.1 Fieldbook
When you have your fieldbook, you can access to the app GerminaQuant for R and go “Fieldbook” tab. Figure 4.1.
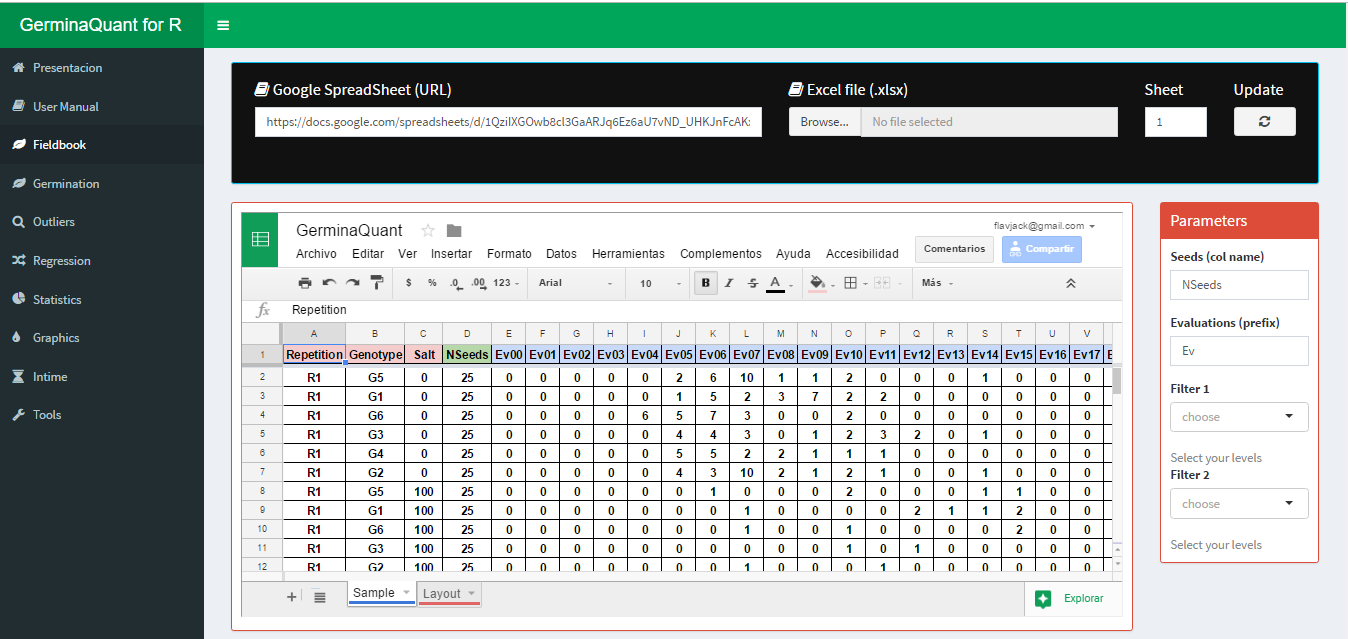
Figure 4.1: Fieldbook interface for import your data
You can paste a Google spread sheet URL or upload a local file in xlsx format. In “Seeds (col name)” you have to write the name of the column containing the information of the number of seed sown in each experimental unit, for “Evaluations (prefix)” you have to put the prefix of the names for the evaluated days from the germination time lapse.
4.2 Germination
If the parameter in the “Fieldbook” tab are correct, in “Germination” tab will be performed and the values of the germination indices will be shown maintaining the experimental design. GerminaQuant allows to copy or downloading the information in “csv” or “xlsx” format. Figure 4.2
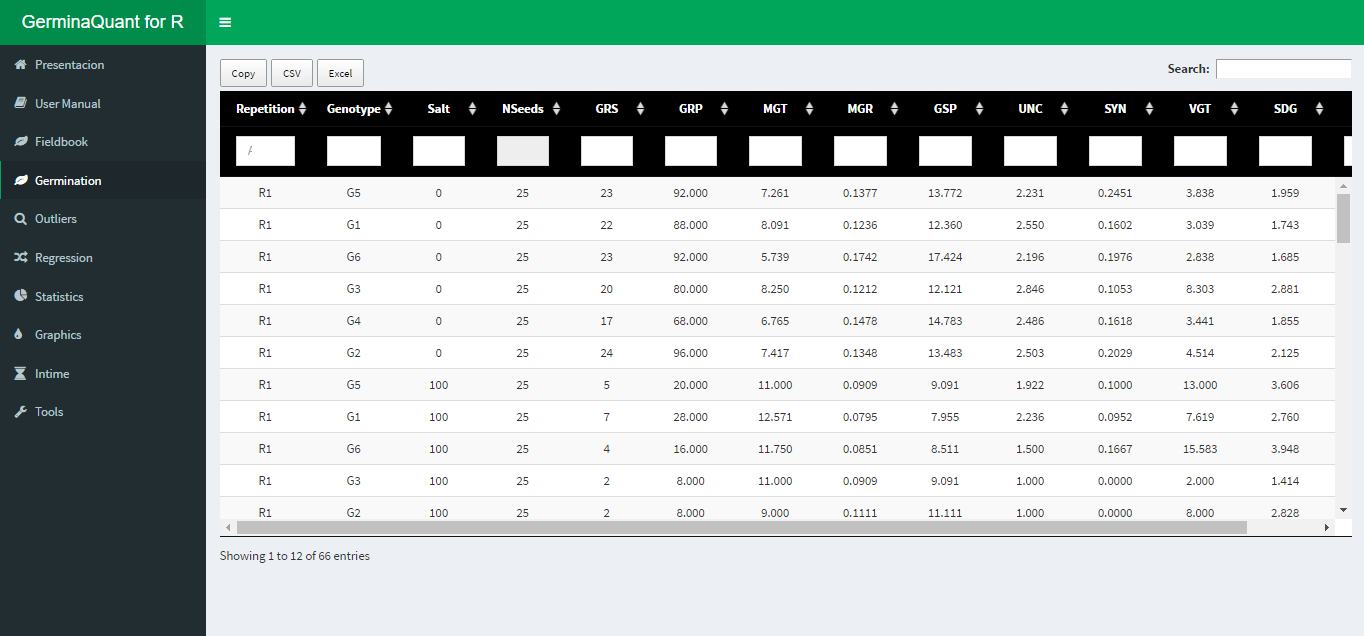
Figure 4.2: Dowload option for the calculated variables
4.3 Statistical
The GerminaQuant application can perform analysis for experimental design in a Complete Randomize Design (CRD), Randomize Complete Block Design (RCBD), Latin Square Design (LSD) or factorial designs, allowing calculate the analysis of variance (AOV) and the mean differences through Student Newman Keuls (SNK), Tukey or Duncan test.
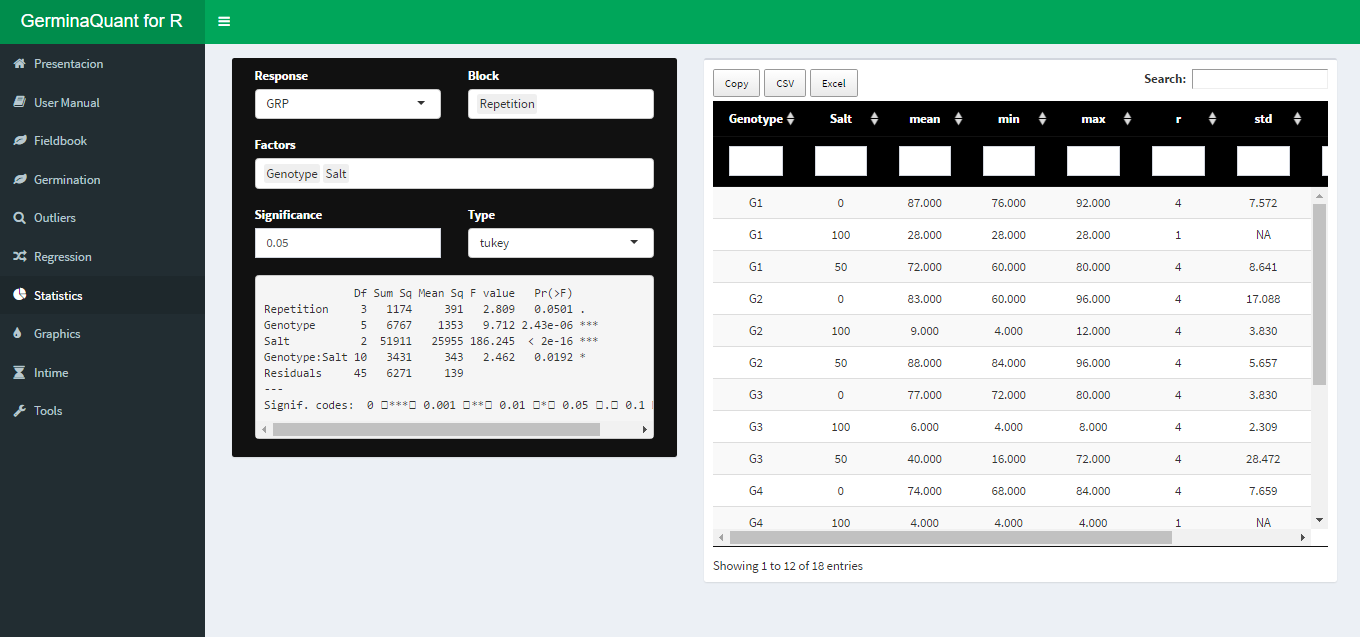
Figure 4.3: Statitical analysis with ANOVA and mean comparison test
4.4 Graphics
Automatically after performed the statistical analysis the application will generate the graphs for the variable chosen with the mean comparison test. The app interface allows customized the graphics in a bar or line plot and export in “tiff” format for publication quality.
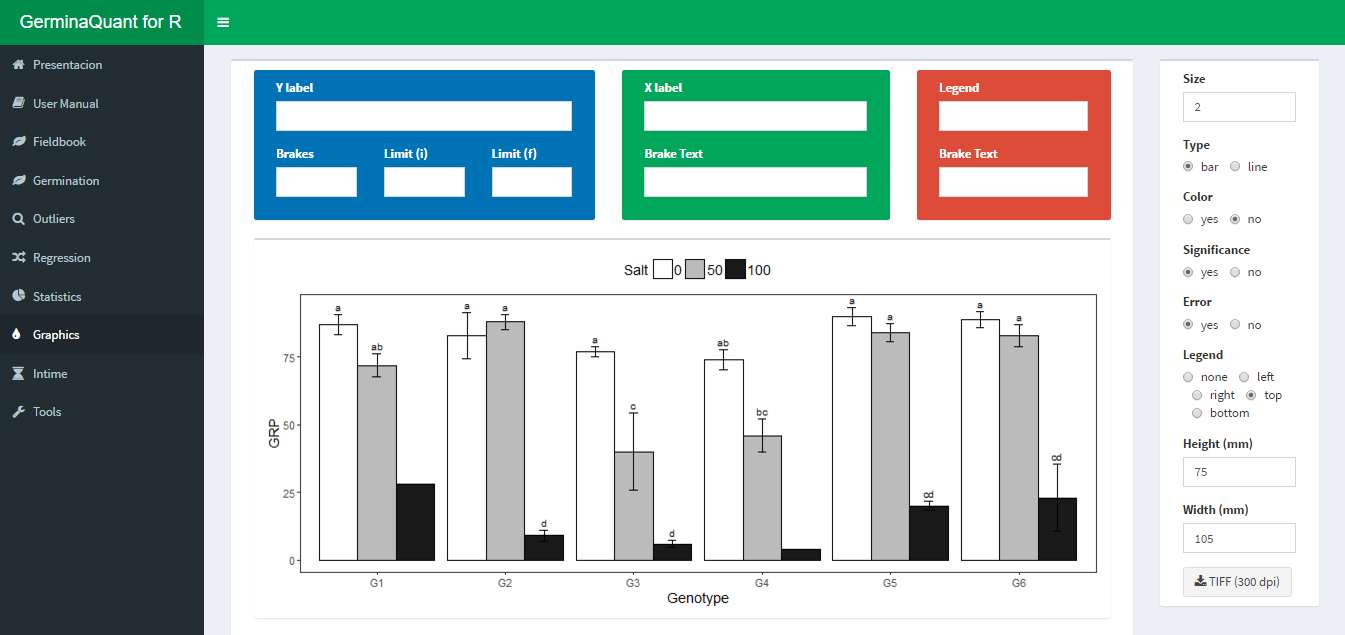
Figure 4.4: Customized interface for bar or line plot
4.5 InTime
This Tab allows to visualize the germination process according one of the experimental factors. The app interface allows customized the graphic. Figure 4.5
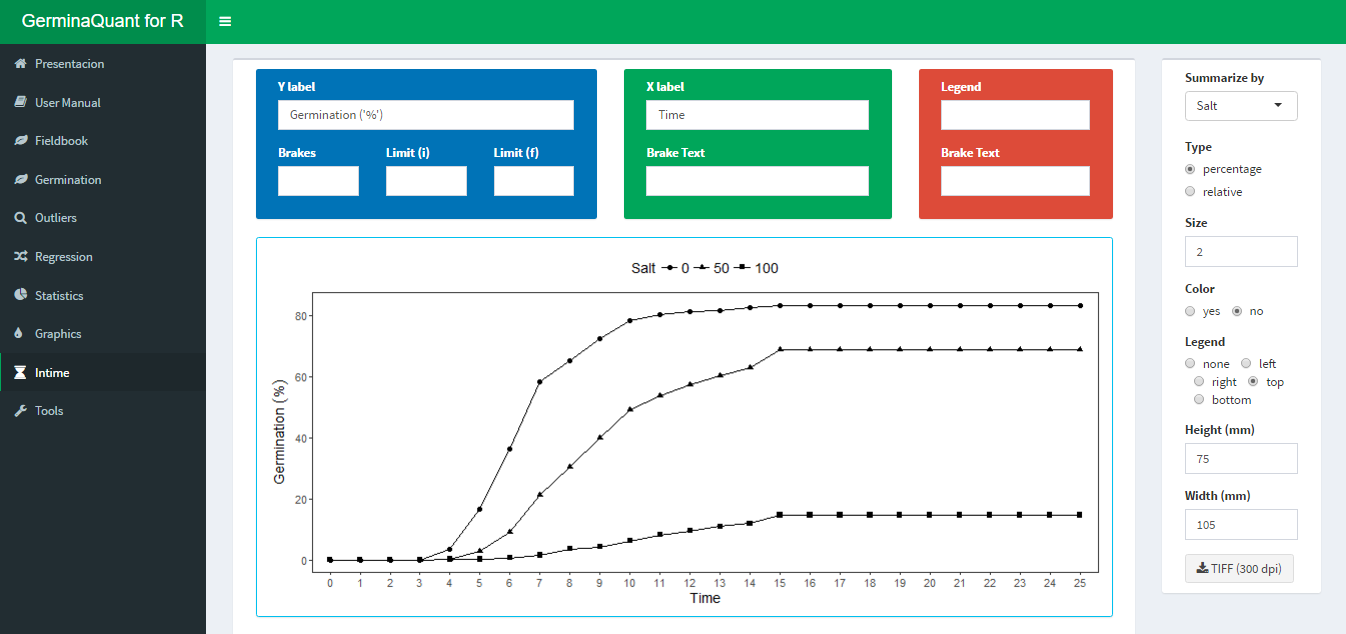
Figure 4.5: Germination in time plot
The application allows to plot two type of graphics, the first is the germination percentage in time lapse, and the second the relative germination that calculates the germination according the total number of germinated seeds.