Figures
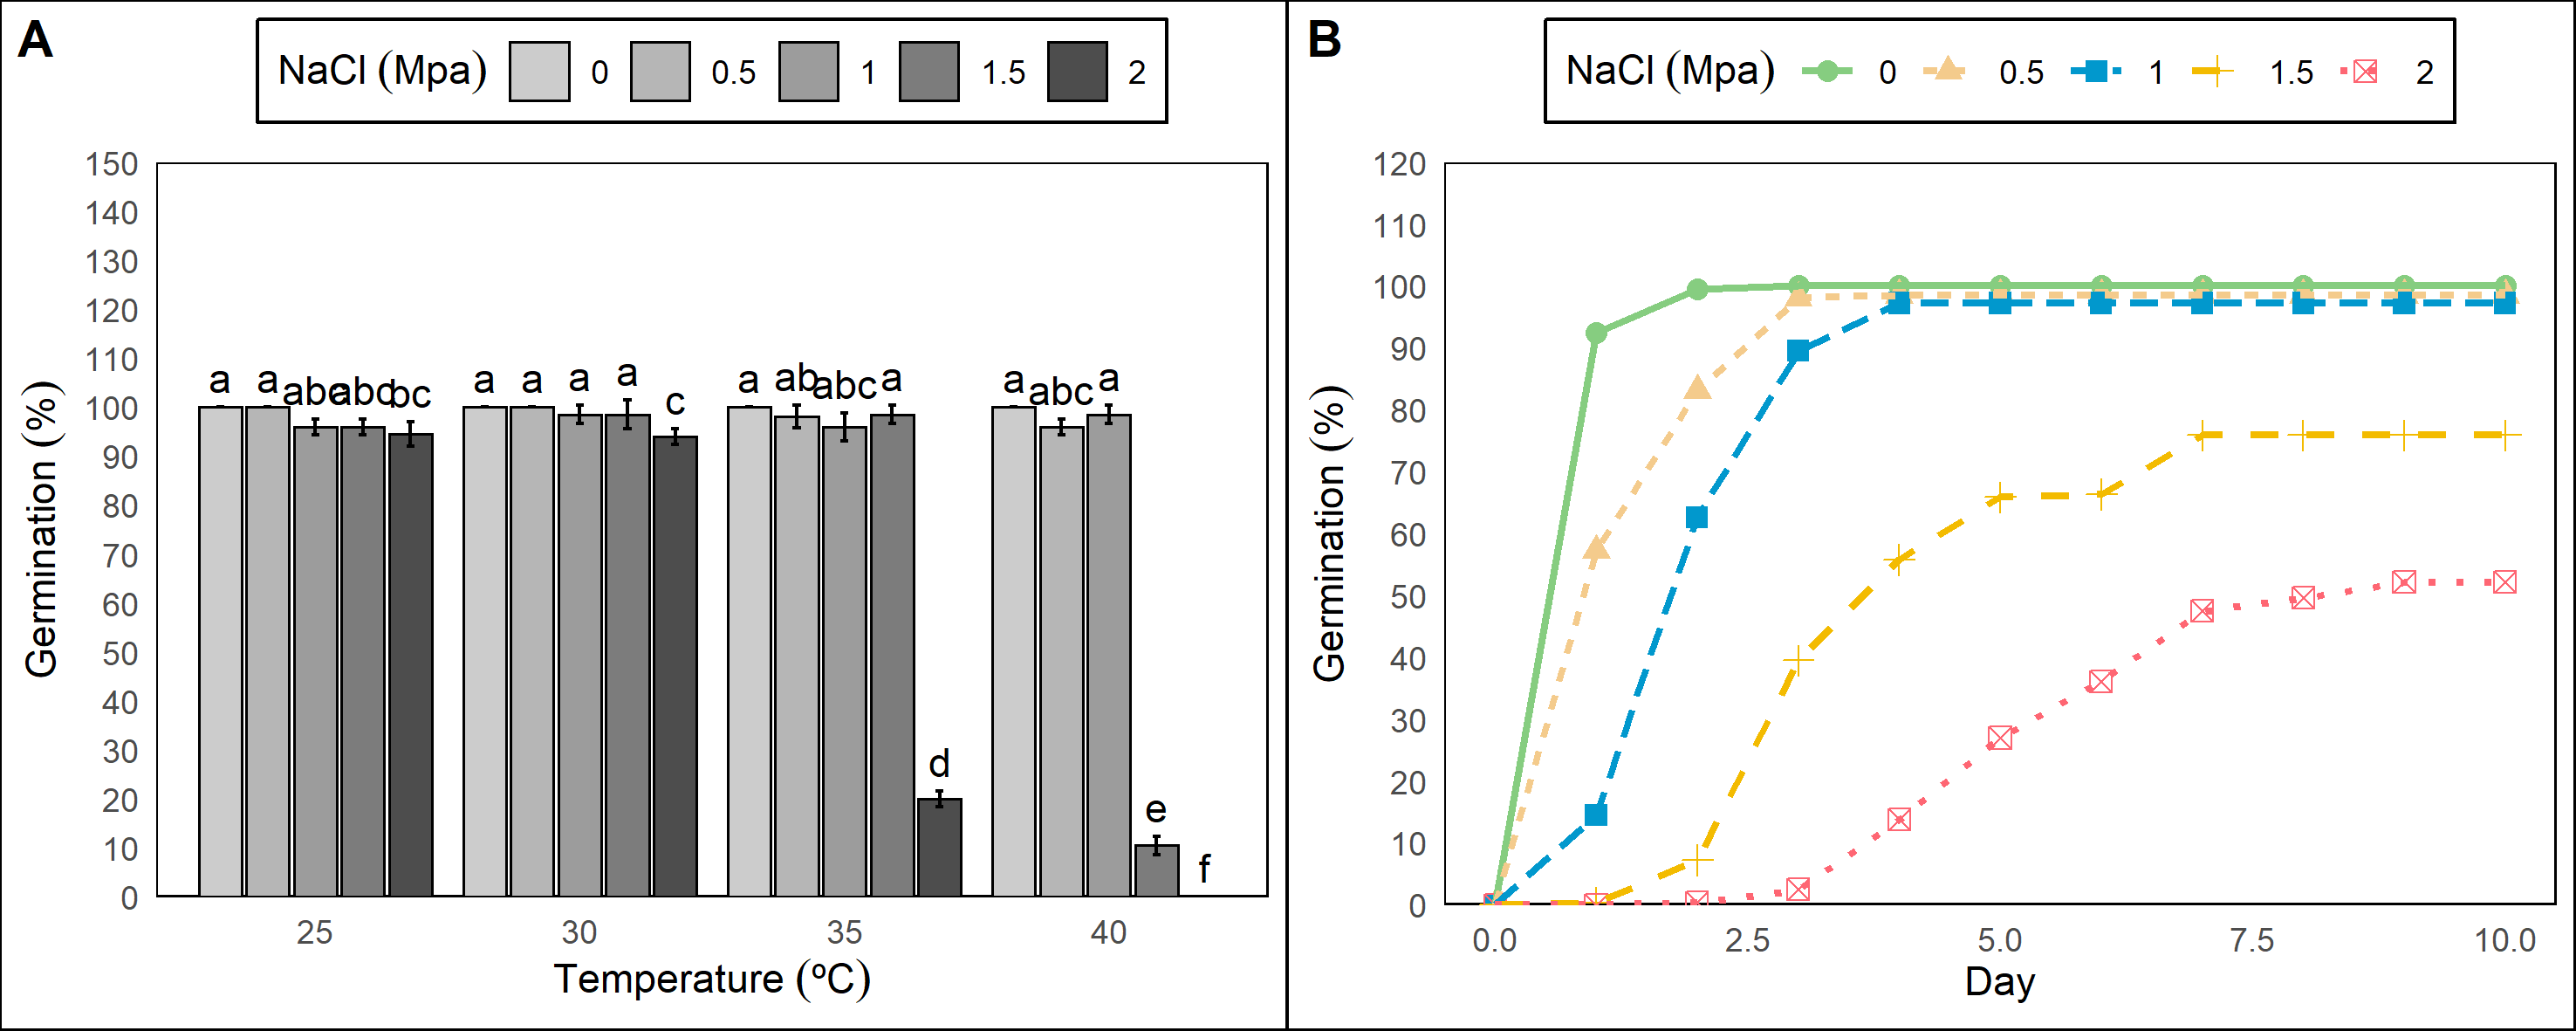
Figure 7.1: Germination experiment with Prosopis juliflor under different osmotic potentials and temperatures. Where: A) Bar graph with germination percentage in a factorial analisys. B) Line graph from cumulative germination under different osmotic potentials.
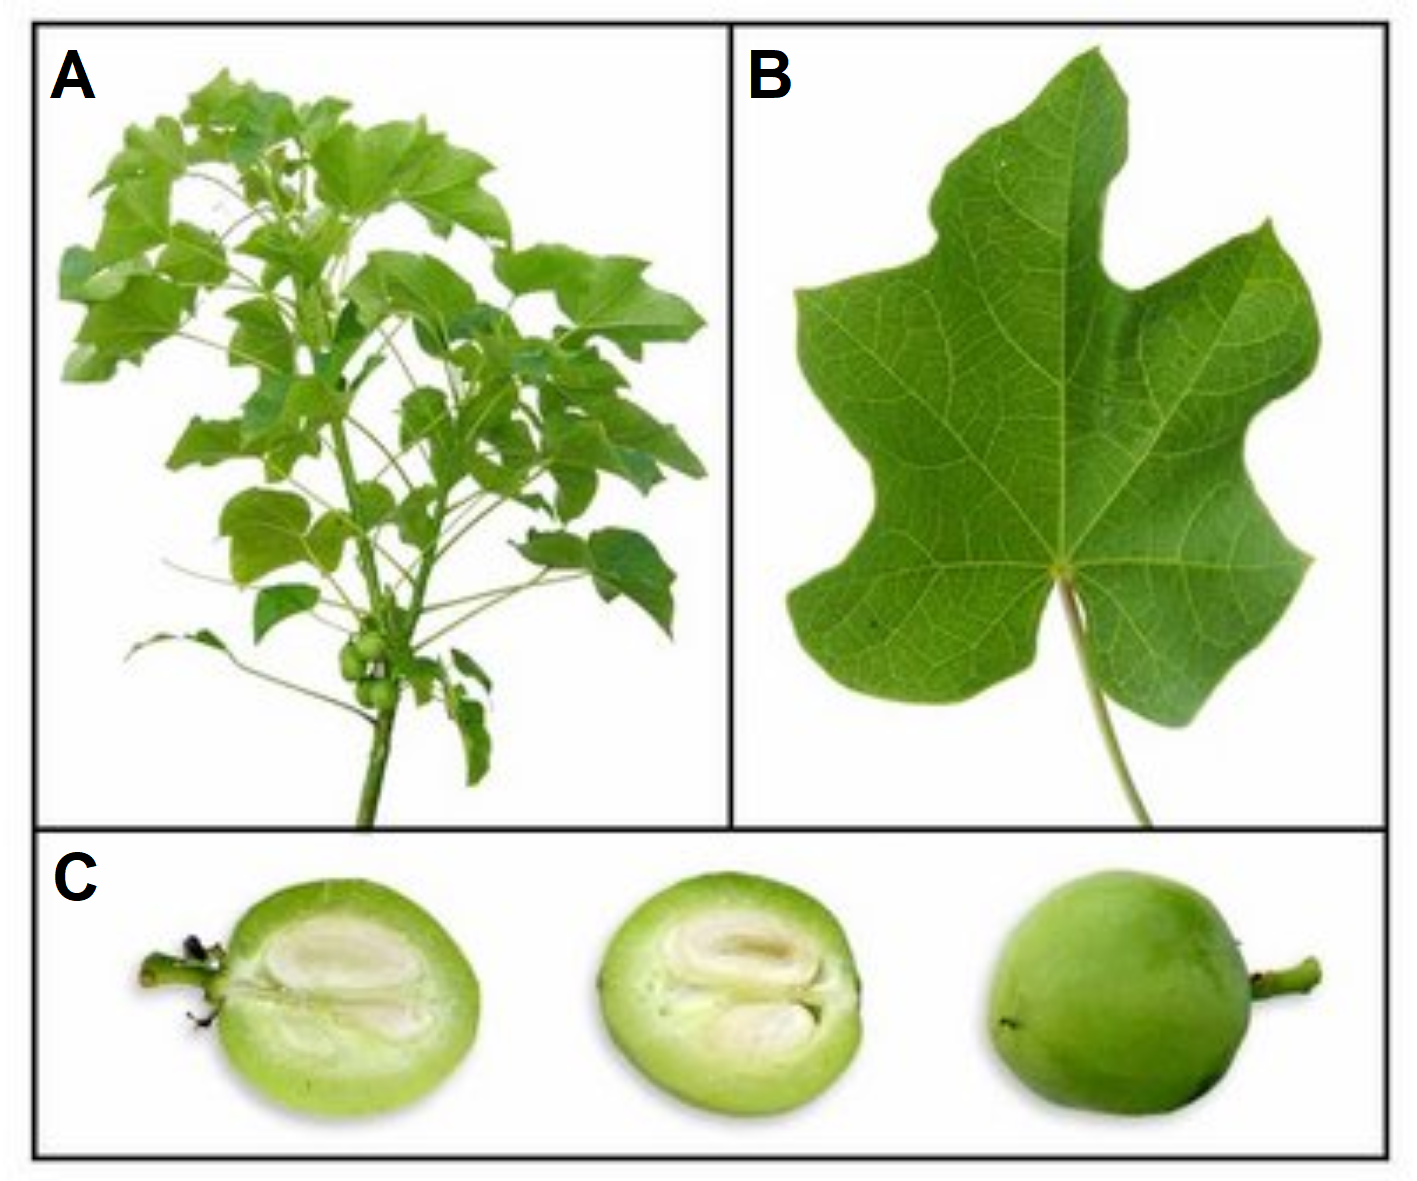
Figure 7.2: Plant of Jatropha curcas. A) Foliage. B) Leaf. C) Fruit.
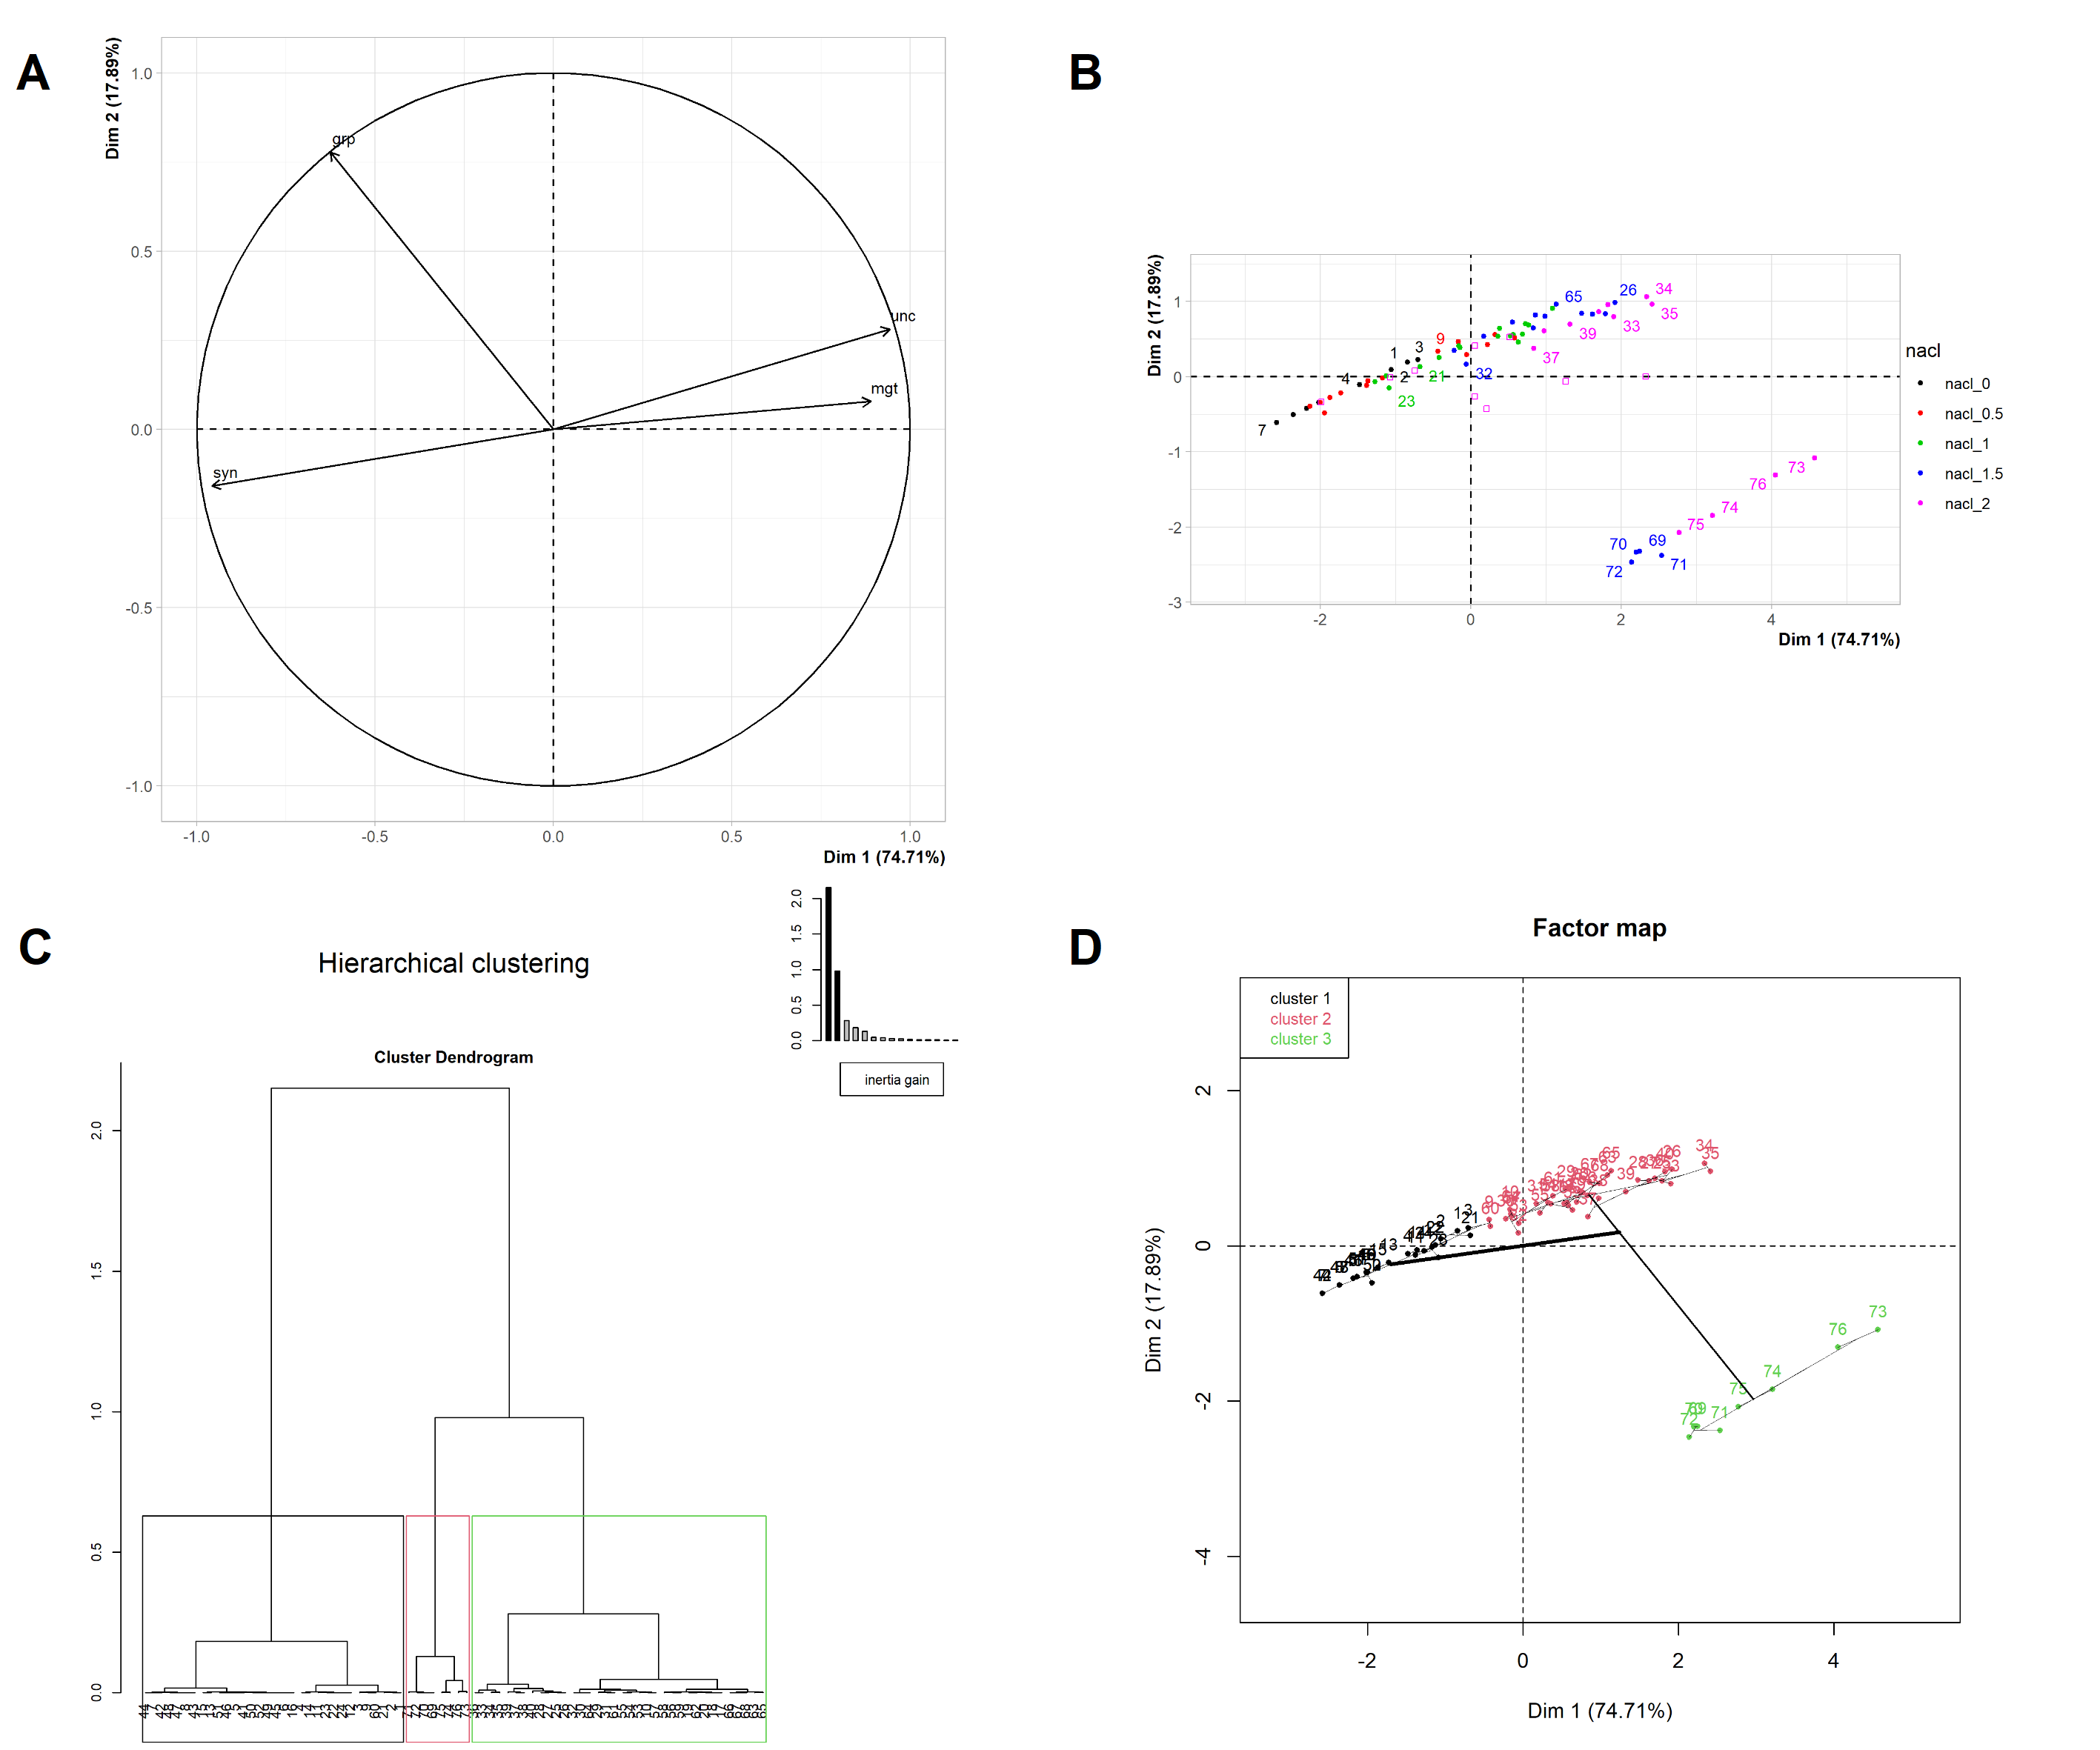
Figure 7.3: Multivariate Analysis: Principal component Analysis and Hierarchical Clustering Analysis.